


Crack the CAT, together. Welcome to the ultimate prep zone for CAT aspirants. From 99 percentilers s...
447

6 hours ago
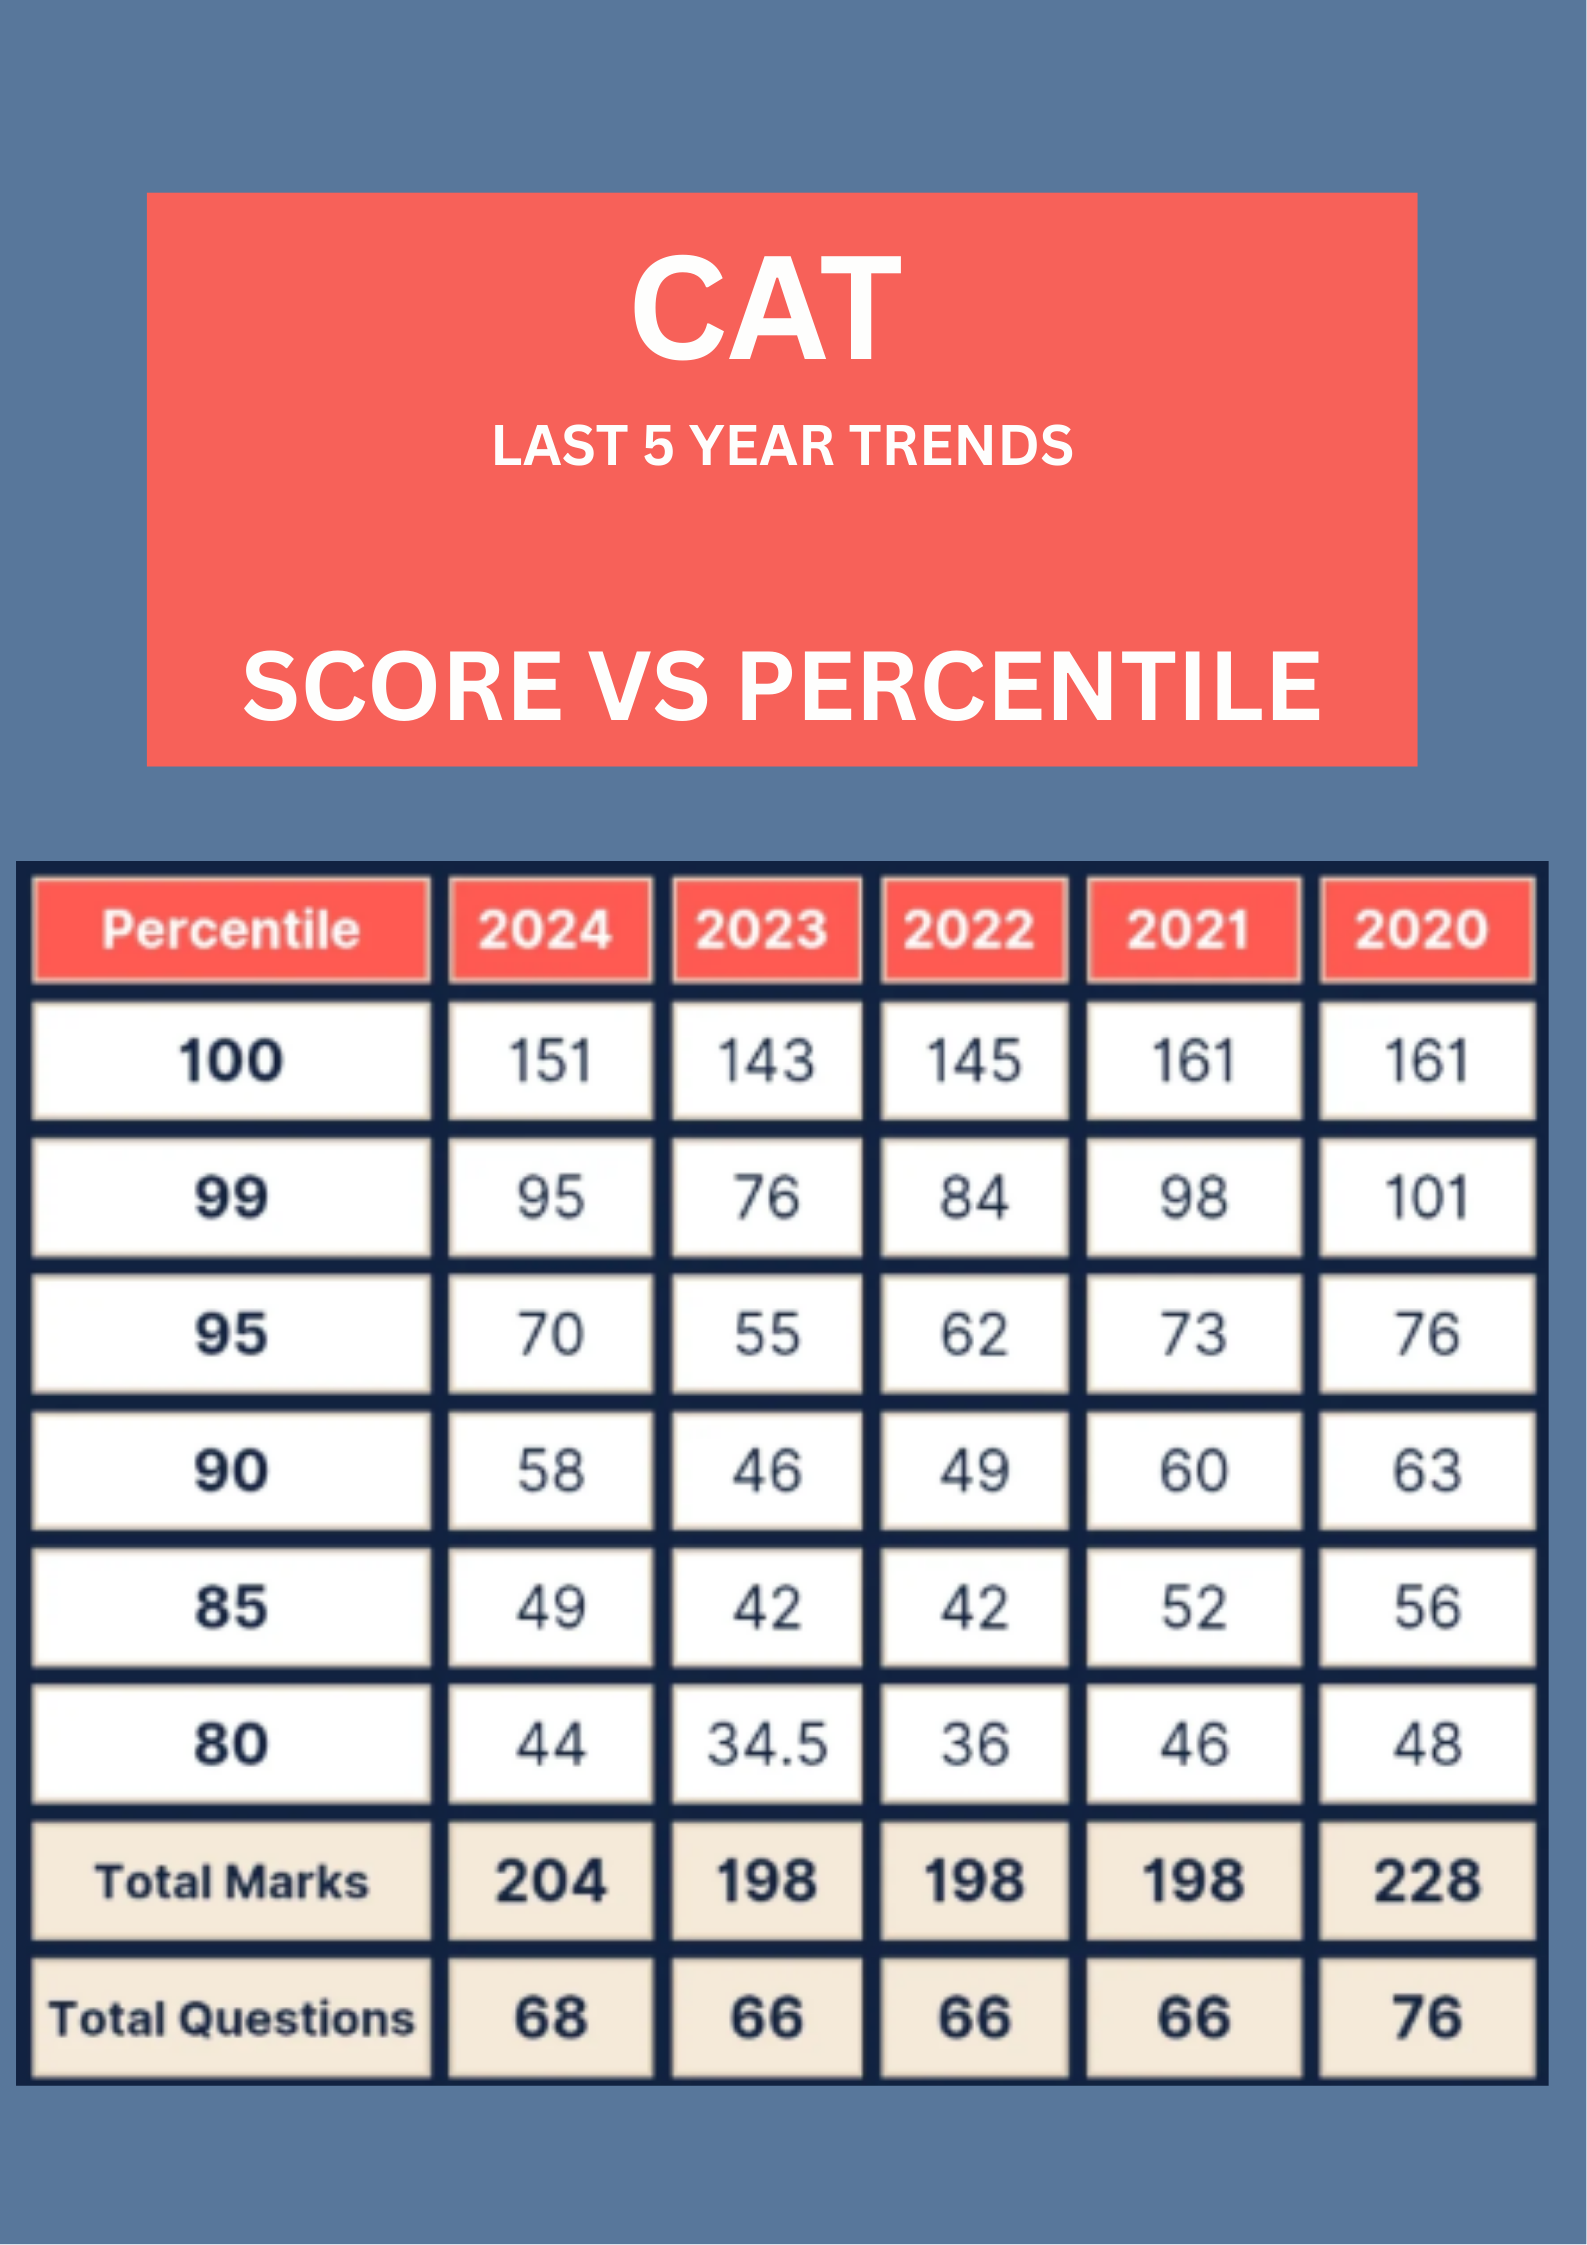
What CAT Score vs Percentile Trends Actually Teach (If You Look Beyond the Numbers)
Body
When most people see CAT score vs percentile trends, they instinctively try to reverse-engineer the exam. “So if I hit this score, I’m safe.” The data quietly disagrees. Year after year, it shows how fragile that thinking is.
- Percentiles are relative, not absolute
A “good score” has no meaning without context. Paper difficulty, question distribution, and normalization change every year. So, stop anchoring yourself to a single raw score. Anchor to percentile bands and plan for variation. - Attempt strategy matters more than effort
When you compare years, high percentiles aren’t always driven by high attempts. They’re driven by controlled aggression selecting the right questions and protecting accuracy. - Sectionals are silent killers
Overall percentiles fluctuate, but sectional cutoffs are stubborn. Many strong candidates lose calls because one section slips below threshold. Trends help you identify which sections are historically unforgiving and deserve disproportionate attention. - Expectation management is a competitive advantage
Students who understand volatility panic less on exam day and result day. That calm translates into better decision-making during the paper and smarter form-filling after results.
Trends help you build realistic college ranges instead of emotional shortlists. This saves money, time, and mental energy during application season.
This data isn’t for prediction. It’s for strategy, discipline, and risk control.